


Quick answer
In Gorgias’s matched cohort of 10,990 ecommerce brands, chat ticket volume rose 47% between January–April 2024 and 2026 while email volume held roughly flat. Half of active brands had less than 2% of tickets on chat. Give chat its own coverage plan and measure what happens to email and repeat contacts before moving staff.
Key findings and sources
Matched-cohort chat and WhatsApp ticket growth
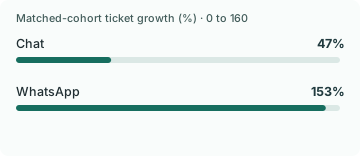
On the same 10,990 Gorgias ecommerce brands, chat ticket volume grew 47% and WhatsApp grew 153% between January–April 2024 and January–April 2026, a 106-point gap. Email volume held roughly flat.
Gorgias Ecom Lab channel mix benchmark
Matched customer-status Gorgias accounts, with an account ticket minimum. Subtract channel-specific growth rates. The percentages do not reveal absolute ticket additions.
Email-only brands were more common than chat-heavy brands
In Gorgias’s recent-period merchant distribution, 10% of brands handled all support by email and about 5.5% handled at least 40% of support via chat. The email-only group was about 1.82 times as prevalent.
Gorgias Ecom Lab channel mix benchmark
Recent-period active accounts, separate from the matched growth cohort. Divide the reported shares of active brands, 10% by about 5.5%.
First-response and resolution gaps differ
Gorgias reported email-to-chat median duration ratios of 38 to one for first response and eight to one for resolution. The first ratio was 4.75 times the second.
Gorgias Ecom Lab channel mix benchmark
Recent-period channel performance using median per account and then across accounts. Divide the reported duration ratios. The source compares channels observationally.
AI resolution rate includes deployment patterns
Gorgias reported an AI resolution rate 6.7 times as high on chat as on email. Its measure divides AI-billed tickets by total tickets in each channel, so the comparison describes observed deployment as well as channel outcomes.
Gorgias Ecom Lab channel mix benchmark
Gorgias’s recent-period channel performance, with the AI architecture cutoff applied. Read the published channel ratio together with its billing-field denominator and deployment caveat.
Compare the results
A growing channel can add work to the inbox
Gorgias compared January–April 2024 with the same months in 2026 for 10,990 ecommerce brands. Holding the merchant cohort steady, chat tickets rose 47%, WhatsApp tickets rose 153%, and email volume remained roughly flat. WhatsApp grew 106 percentage points faster than chat. The initial ticket counts for those channels differ, so that spread says little about which channel added more tickets or which one should get an extra agent.
For a store considering chat, the immediate budget question is how many support hours it needs while email volume holds. Forecast incoming chats from your own eligible shopping sessions, then measure handled minutes and follow-up after launch. A growing chat queue can reflect new questions that shoppers previously gave up on. It can also reflect questions already being asked in email. Count unique issues as well as tickets so the two possibilities do not look identical.
Separate speed from resolution
The report found a 38-fold first-response duration difference between email and chat, compared with an eightfold resolution-duration difference. The first-response ratio was 4.75 times the resolution ratio. A fast opening message can matter to someone at checkout, especially if it answers a question they can act on. For a delayed order with an address problem, what matters next is whether anyone can change the record or clearly explain the available options.
Gorgias reports an AI resolution rate 6.7 times as high on chat as on email. Its operational definition uses AI-billed tickets over all tickets in the channel. That is evidence about where merchants deployed and used AI, with different workflows and issue mixes. It cannot tell whether the same address, delivery or payment question would be resolved better by the same automation on another channel. Compare outcomes by intent before using the reported ratios to set staffing targets.
Keep the shopper’s follow-up in the staffing plan
Ten percent of active brands in Gorgias’s recent-period distribution handled all support in email, versus about 5.5% with chat accounting for at least 40% of tickets. Half had less than 2% of their support volume on chat. The fast-growing matched-cohort channel and the typical brand’s actual support mix answer different planning questions.
For a checkout pilot, choose one shift and route narrow purchase questions such as size, shipping dates or a payment-step error to chat. When the first response cannot resolve the issue, keep the question and last verified cart or order state attached to the follow-up. Review first useful reply, time to a completed answer, reopened issues and agent minutes across chat and email. If chats remain mostly after-order issues that need a specialist or proof a shopper must send, route those cases to an owned follow-up queue and staff for that work. Add coverage when the issue mix and completed resolutions justify it.
Check what happens after chat closes. When someone emails two hours later with the same question, count that as a repeat issue in the pilot. A fast closure with a second human touch is a different staffing result from a single resolved chat.
Study data
| Measure | Value | Context |
|---|---|---|
| Matched brands | 10,990 brands | Gorgias identified 10,990 brands in the matched-cohort analysis. |
| Chat ticket volume growth | 47% | Chat ticket count rose 47%. |
| WhatsApp ticket volume growth | 153% | WhatsApp ticket count rose 153%. |
| Brands using email for all support | 10% | Ten percent of brands handled all support through email. |
| Brands with at least 40% of support volume on chat | 5.5% | Roughly 5.5% of active brands had 40% or more of their tickets on chat. |
| Median brand email share | 85% | Gorgias reports email’s share at the median active brand as 85%. |
| Chat share below which half of active brands fell | 2% | Half of active brands had less than 2% of support volume on chat. |
| Chat-to-email AI resolution rate ratio | 6.7 times | Gorgias reports the AI resolution rate as 6.7 times as high on chat. |
| Email-to-chat first-response duration ratio | 38 times | The report describes chat first response as 38 times faster than email. |
| Email-to-chat resolution duration ratio | 8 times | The report describes chat resolution as eight times faster than email. |
| Minimum matched-cohort account ticket count | 60 tickets | Accounts had at least 60 tickets across the comparison windows. |
| Minimum recent-period account ticket count | 30 tickets | Per-account distribution and per-channel performance require at least 30 tickets. |
| Recent-period analysis lookback | 90 days | The recent-period analysis looks back 90 days, with a seven-day billing lag. |
What changes when you compare the figures
| Comparison | Result | Calculation |
|---|---|---|
| WhatsApp growth above chat growth | 106 percentage points | = 153 - 47 |
| WhatsApp percentage growth relative to chat | 3.2553 times | = 153 / 47 |
| Email-only brand prevalence relative to chat-heavy prevalence | 1.8182 times | = 10 / 5.5 |
| Relative size of the first-response and resolution duration ratios | 4.75 times | = 38 / 8 |
Methodology and sources
We transcribed Gorgias’s May 2026 report. The growth rates use a 10,990-brand matched cohort. Brand adoption and channel performance come from a different recent-period sample. Calculations contrast like units within each sample and retain Gorgias’s published rounding. None of the comparisons identifies the causal effect of moving work between channels.
Download the source data (CSV)
Download the calculations (CSV)
Related reading
AI customer support escalation statistics
AI customer support productivity statistics
AI customer support quality and repeat contact statistics
Peak-season ecommerce support queue statistics by shopper question
Sources and definitions
Gorgias Ecom Lab channel mix benchmark
The source data includes the population, period, denominator and limitations for every figure.