


Quick answer
In a staggered rollout to technical support agents, AI suggestions increased issues resolved per hour by about 15% on average. Brynjolfsson, Li and Raymond’s preferred specification estimated 0.301 additional resolutions per hour. The lowest prior skill quintile improved by 36%, while the highest had no significant throughput change. This was an assistive tool used by humans in one company.
Key findings and sources
How much did AI assistance improve resolution throughput?
In the 2025 QJE study of 5,172 human technical support agents, Brynjolfsson, Li and Raymond reported about 15% more issues resolved per hour after AI access. The preferred Table II coefficient was 0.301 resolutions per hour.
Brynjolfsson, Li and Raymond, Generative AI at Work
Did support chats become shorter?
Table III of the 2025 QJE technical support study estimated a 3.746-minute decline in average chat duration after AI access, with 21,839 agent-month observations. This is an average effect in one rollout.
Brynjolfsson, Li and Raymond, Generative AI at Work
Did new agents benefit more?
In Figure IV of the 2025 QJE study, agents with less than one month of tenure at rollout improved by about 0.7 resolutions per hour. The authors found no effect for agents with more than a year of tenure.
Brynjolfsson, Li and Raymond, Generative AI at Work
What happened to the lowest prior skill group?
In Figure III of the 2025 QJE technical support study, the lowest pretreatment skill quintile gained 0.5 resolutions per hour, equivalent to 36% for that group. The most skilled group showed no significant productivity change.
Brynjolfsson, Li and Raymond, Generative AI at Work
Does higher throughput mean a higher resolution rate?
Table III of the 2025 QJE study estimated a 1.32-point increase in chat resolution rate with 12,295 agent-month observations. The authors described the change as statistically insignificant.
Brynjolfsson, Li and Raymond, Generative AI at Work
How large were the chat duration and handling rate changes relative to baseline?
In Brynjolfsson, Li and Raymond’s software support study, dividing the Table III coefficients by the rounded pretreatment means gives approximately 8.71% shorter chats and 15.21% more chats handled per hour. These are separate outcomes and approximations, not measures of staffing hours saved.
Brynjolfsson, Li and Raymond, Generative AI at Work
Standardized workload gives two distinct productivity scales
Brynjolfsson, Li and Raymond’s preferred effect of 0.301 additional resolutions per agent-hour is 30.1 per 100 hours. Their separate estimate of −3.746 minutes per chat is −374.6 aggregate minutes per 100 chats. The two effects have distinct exposure units.
Brynjolfsson, Li and Raymond, Generative AI at Work
The resolution-rate estimate spans a small decline and a gain
The customer support rollout’s 1.32-point resolution-rate estimate and 0.882-point standard error imply an approximate 95% interval from −0.41 to +3.05 points.
Brynjolfsson, Li and Raymond, Generative AI at Work
Technical support rollout, the resolution-rate regression using 12,295 agent-month observations. Apply a normal approximation of coefficient plus or minus 1.96 clustered standard errors.
The resolution model used fewer observations than the throughput model
The published customer support rollout used 12,295 agent-month observations for resolution rate and 21,839 for chats per hour. The former is 56.30% of the latter count.
Brynjolfsson, Li and Raymond, Generative AI at Work
Technical support rollout, outcome-specific agent-month regression samples. Divide the resolution-rate observation count by the chats-per-hour observation count.
Compare the results
Count resolved issues per hour alongside chat volume
A team can take more chats without resolving more issues. The field study separates time spent on an individual chat, chats handled per hour, the share of chats resolved and the resulting throughput. The preferred estimate of 0.301 extra resolutions per hour is more informative for staffing than the 0.365 increase in chats handled per hour on its own. The regression sample is smaller for the resolution measures than for chat volume, so the coefficients should not be multiplied together as though every row covered the same observations.
A checkout team can make the same distinction with its own data. For a delivery question, success means answering with the correct available date. For an order change, inspect whether the approved edit appears on the order. A closed message is a useful process event, but measure later contact about the same issue as a separate check. Staff can appear faster if unresolved questions are closed earlier and return in a new conversation.
The apparent gain depends on the comparison
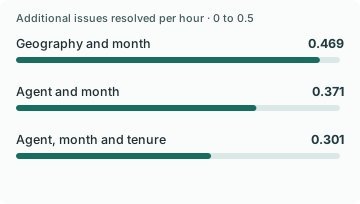
The authors report 0.469 additional resolutions per hour with location and time controls, 0.371 when they include individual agent effects, and 0.301 when they also include agent tenure. The gap between the first and third point estimates is 0.168 resolutions per hour. Because controls and sample counts differ, the gap shows sensitivity to specification rather than isolating a single source of bias.
For a store pilot, begin by comparing similar people, shifts and queues. If newer staff take simpler questions during the rollout, a faster team average may reflect work allocation. Keep an unchanged comparison queue or randomize access where feasible, record which questions each shift handled, and compare both handling speed and the outcome. Keep staff time spent reading and correcting suggestions in the denominator.
Target help where the useful answer is hard to find
The study estimates 0.5 additional resolutions per hour, or 36%, for agents in the lowest pretreatment skill quintile. Agents with under one month of tenure improved by about 0.7 resolutions per hour, while the most experienced workers had no significant throughput gain. These groups are defined before rollout. They describe the study's distribution and cannot be used to assign a performance improvement to a specific employee.
For merchant operations, identify the early-tenure cases where a new person repeatedly searches for an answer, such as which international orders can change address after dispatch. A suggestion should surface the relevant policy and current order state. Give experienced staff an easy way to reject it and retain the issue type in your audit so that gains on common questions cannot conceal new mistakes on uncommon ones.
Put accuracy and repeat contact beside the speed chart
The paper's average resolution-rate estimate was about 1.3 percentage points and statistically insignificant. Net promoter score showed no meaningful change on average. These findings do not mean that every queue retained quality. The authors report small declines on some quality measures among the strongest performers. The speed gain and quality outcome need separate readings, especially where the cost of a wrong reply is high.
Review a sample of faster replies for policy accuracy, approved actions and the next event. Include a delayed-contact window so a customer who returns two days later can be recognized. Roll out when the support team resolves more verified issues per hour without an unacceptable change in repeat contact or incorrect actions. Apply the measured lift to staffing only after the pilot covers your own mix of questions and shifts.
One useful review pairs a faster reply with a concrete downstream record. For a refund question, check whether the explanation matches the order, whether any promised update appears and whether the shopper opens the same issue again. For a queue with sparse ratings, report how many customers supplied them. A high average from a small, changing group can give an optimistic impression of quality.
Read minutes saved beside chats handled
Brynjolfsson, Li and Raymond report an average chat-duration reduction of 3.746 minutes and 0.365 additional chats handled per hour in Table III. Dividing by the earlier rounded means of 43 minutes and 2.4 chats per hour gives approximately 8.71% shorter chats and 15.21% more chats per hour. Those are descriptive conversions of the fitted coefficients using rounded baselines. The two measures need not rise and fall by equal percentages.
Support agents can handle more than one conversation at a time. A customer waiting for a reply still contributes elapsed time to a chat, while the agent may be working on another ticket. That is why 43 minutes per chat and 2.4 chats handled per hour can both describe the baseline. Treat them as different measures and avoid dividing a staffing plan by the average duration as if conversations never overlapped.
For a checkout help team, compare elapsed time from the customer's first message, agent workload across all open chats and resolved issues per hour. Track a delayed payment or delivery case through resolution rather than counting the moment a suggestion was delivered. The schedule should be based on actual staff time and completion, with shorter chats as supporting evidence.
Convert an hourly result into a staffing question
The preferred throughput estimate was 0.301 additional resolutions per agent-hour. On a common exposure scale, that is about 30.1 additional resolutions per 100 agent-hours in the study’s setting. The paper also reports a handle-time coefficient of −3.746 minutes per chat. On 100 chats that coefficient corresponds to 374.6 aggregate minutes, about 6.24 hours. Those two illustrations start from different units. Do not add them or turn the 6.24 hours into an identical reduction in paid shifts.
Agents can handle several chats at once, take on more complex cases or have idle capacity at different hours. A minute saved inside a chat is useful if it releases attention during a constrained interval. In a store where a queue is quiet most mornings and overloaded after lunch, the same average time reduction can have different staffing value in those two periods.
Before reducing cover, look at the worst queues separately and check whether more of the same kind of issue is resolved per paid hour. Follow the cases that move into the queue after an assistant answers. If remaining cases are slower or require a specialist, the right measure may be fewer overdue checkout questions rather than fewer people scheduled. Capture quality and shopper recontact alongside throughput so a quick but incomplete reply does not count as a staffing gain.
Check how precisely the rollout measured whether issues were resolved
Brynjolfsson, Li and Raymond estimated a 1.32-point change in the resolution rate and reported a clustered standard error of 0.882 points. A normal approximation gives a 95% interval of about −0.41 to +3.05 percentage points. This interval leaves room for a modest deterioration as well as an improvement. The paper separately estimates more chats handled per hour, so the evidence for throughput is more decisive than the evidence for the resolution proportion.
The resolution-rate specification used 12,295 agent-month observations, 56.30% of the 21,839 observations used for chats per hour. These are regression observation counts and do not establish how many conversations were unresolved or why the counts differ. A multiplication of the two regression coefficients would mix different outcomes and analysis samples.
The two outcomes have different uncertainty because they have different denominators and variation. A precise estimate of handling speed cannot narrow the uncertainty around the share resolved. When summarizing the rollout, quote the resolution estimate and interval together, and say whether the outcome was observed for the queue whose staffing is under review.
Decide whether a speed win meets the resolution floor
Set a minimum acceptable resolution change before the pilot. For example, a one-point deterioration might be tolerable for a low-risk status queue and unacceptable for payment disputes. Compare the lower confidence limit with the chosen floor, using a model that accounts for repeat observations at the agent level. Also inspect where resolution is recorded and whether some agents’ issues are easier to classify.
Report chats per hour, durable resolutions per hour, and the fraction of chats with usable outcome tracking. A queue whose tracking only covers simple tickets can appear productive while difficult cases go missing. If a pilot fails the coverage or precision check, keep it in a limited queue and collect more comparable outcomes before changing staffing assumptions.
For a practical pilot, sample resolved and unresolved tickets under both policies. Verify that a claimed resolution has a current order or support record behind it. If the AI changes which cases agents mark resolved, an apparent throughput improvement may partly reflect a recording change. Validate the label before using it to plan headcount.
Study data
| Measure | Value | Context |
|---|---|---|
| Human agents in the technical support study | 5,172 agents | Staggered rollout population. |
| Chats represented in the full study | 3,006,395 chats | Full descriptive sample, not the number of regression observations. |
| Pretreatment mean resolution throughput | 1.97 resolutions/hour | Baseline used to contextualize the study’s estimated effect. |
| Resolutions per hour effect, Geography and month controls | 0.469 resolutions/hour | Coefficient on access to AI suggestions. Model controls and estimation samples can differ. |
| Resolutions per hour effect, Agent and month controls | 0.371 resolutions/hour | Coefficient on access to AI suggestions. Model controls and estimation samples can differ. |
| Resolutions per hour effect, Agent, month and tenure controls | 0.301 resolutions/hour | Coefficient on access to AI suggestions. Model controls and estimation samples can differ. |
| Relative resolution throughput effect under preferred specification | 15.2% | Published estimate relative to pretreatment throughput. |
| Change in average chat duration | -3.746 minutes | Difference-in-differences coefficient. |
| Change in chats handled per hour | 0.365 chats/hour | Difference-in-differences coefficient. |
| Change in resolution rate | 1.32 percentage points | Authors report no statistically significant change. |
| Change in net promoter score | -0.119 NPS points | Authors report no economically significant change. |
| Pretreatment average chat duration | 43 minutes | Rounded baseline. The regression coefficient has more precision than the prose baseline. |
| Pretreatment chats handled per hour | 2.4 chats/hour | Rounded baseline. |
| Lowest prior skill quintile throughput effect | 0.5 resolutions/hour | Skill index combines speed, resolution and customer satisfaction. |
| Lowest prior skill quintile relative throughput effect | 36% | Relative to subgroup baseline. |
| Throughput effect with less than one month of tenure | 0.7 resolutions/hour | Tenure analysis separately controls for prior skill quintile. |
| Tenure of treated agents at reported experience-curve comparison | 2 months | At roughly two months, their throughput was comparable with untreated agents with more than six months of tenure. |
| Resolution-rate coefficient clustered standard error | 0.00882 share | Standard error clustered at agent level. |
| Observations in chats-per-hour specification | 21,839 agent-month observations | Count of agent-month observations. |
| Observations in resolution-rate specification | 12,295 agent-month observations | Count of agent-month observations. |
What changes when you compare the figures
| Comparison | Result | Calculation |
|---|---|---|
| Preferred estimate relative to the reported rounded baseline | 15.28% | = 0.301 / 1.97 * 100 |
| Change in throughput coefficient from column 1 to column 3 | 0.168 resolutions/hour | = 0.469 - 0.301 |
| Approximate lower 95% bound for the preferred throughput coefficient | 0.237 resolutions/hour | = 0.301 - 1.96 * 0.0329 |
| Approximate upper 95% bound for the preferred throughput coefficient | 0.365 resolutions/hour | = 0.301 + 1.96 * 0.0329 |
| Estimated shorter chat duration relative to the rounded pretreatment mean | 8.71% | = 3.746 / 43 * 100 |
| Estimated additional chats per hour relative to the rounded pretreatment mean | 15.21% | = 0.365 / 2.4 * 100 |
| Preferred throughput effect per 100 agent-hours | 30.1 resolutions | = 0.301 * 100 |
| Magnitude of the handle-time effect over 100 chats | 374.6 minutes | = 3.746 * 100 |
| Magnitude of the handle-time effect in hours per 100 chats | 6.24 hours | = 3.746 * 100 / 60 |
| Approximate lower 95% limit for the resolution-rate change | -0.41 percentage points | = (0.0132 - 1.96 * 0.00882) * 100 |
| Approximate upper 95% limit for the resolution-rate change | 3.05 percentage points | = (0.0132 + 1.96 * 0.00882) * 100 |
| Resolution-rate observations relative to chats-per-hour observations | 56.3% | = 12295 / 21839 * 100 |
| Agent-month observation count difference across the two outcome models | 9,544 agent-month observations | = 21839 - 12295 |
Methodology and sources
We use the final 2025 Quarterly Journal of Economics article. Table II estimates resolutions per hour under several regression specifications. Table III reports additional outcomes with different regression sample counts. The skill and tenure analyses classify workers before access and control for the other factor. For a direct read, use the authors’ preferred estimates and treat the other specifications as a sensitivity comparison. The study concerns one technical support organization, not ecommerce staffing or autonomous checkout recovery. Approximate intervals below use 1.96 times the reported standard error; the paper's fixed-effects design still determines interpretation.
Download the source data (CSV)
Download the calculations (CSV)
Related reading
AI customer support escalation statistics
AI customer support quality and repeat contact statistics
Peak-season ecommerce support queue statistics by shopper question
Sources and definitions
Brynjolfsson, Li and Raymond, Generative AI at Work
The source data includes the population, period, denominator and limitations for every figure.