


Quick answer
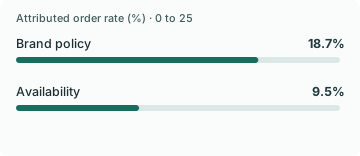
Gorgias Ecom Lab reported that daily pre-purchase question volume rose about 51% in its 2025 Black Friday and Cyber Monday window. Brand policy’s share rose from 15.3% to 17.6%. On a baseline of 100 pre-purchase tickets per day, those rounded inputs imply about 11 additional daily policy tickets out of 51 total additional tickets. In the separate 2026 observation window, policy questions had an 18.7% attributed order rate in Shopping Assistant conversations versus 9.5% for availability.
Gorgias Ecom Lab pre-purchase question study · Gorgias Ecom Lab after-hours pre-purchase question study
Key findings and sources
Policy questions grew faster than the holiday queue
In Gorgias Ecom Lab’s 2025 BFCM analysis, daily pre-purchase volume rose about 51% and policy share rose from 15.3% to 17.6%. Normalizing the rounded source figures to 100 baseline daily questions implies about 11.3 additional policy questions out of 51 total additional questions.
Gorgias Ecom Lab pre-purchase question study
Policy accounted for about one fifth of the modeled extra queue
Using Gorgias’s rounded 2025 seasonal inputs, brand policy accounted for approximately 22.1% of the increase in normalized daily pre-purchase conversation volume. The calculation describes queue composition, not sales.
Gorgias Ecom Lab pre-purchase question study
Policy and availability rates differed in assisted conversations
In Gorgias Ecom Lab’s May to August 2026 Shopping Assistant sales conversations, brand policy had an 18.7% attributed order rate and availability had 9.5%. The 9.2 percentage-point gap is observational and limited to those conversations.
Gorgias Ecom Lab pre-purchase question study
Satisfaction did not measure everyone who waited
Gorgias’s July 2026 analysis reported that the median brand received 53% of buying questions outside business hours. Positive CSAT among rated pre-purchase interactions was 86% in hours and 85% after hours, a one-point gap.
Gorgias Ecom Lab after-hours pre-purchase question study
Roughly one third of extra policy questions came from mix in a benchmark reconstruction
At Gorgias’s rounded 2025 peak rates, adding volume at the original mix gives 7.80 extra policy questions per 100 baseline daily questions. Applying the peak mix adds 3.47 more, about 30.80% of the total increase.
Gorgias Ecom Lab pre-purchase question study
Gorgias pre-purchase questions, 2025 BFCM period versus September and October baseline. Normalize to 100 baseline questions, increase to 151 at 15.3%, then apply 17.6% at the peak volume.
Volume-only forecasting misses policy questions when their share rises
Holding the 15.3% baseline policy share through 51% growth would omit approximately 347 policy questions per 10,000 baseline pre-purchase questions in the Gorgias reconstruction.
Gorgias Ecom Lab pre-purchase question study
Worked forecast using Gorgias 2025 BFCM daily volume and policy mix rates. Multiply 15,100 projected peak questions by the 2.3-point policy share change.
Compare the results
A busier queue can need a different mix of answers
For a checkout team, ten additional stock questions and ten additional promotion-policy questions mean different work. Stock can often be checked against a current variant and location. A question about stacking discounts or a warranty exception may need a person with permission to decide. A staffing model based only on how many tickets arrive misses that difference.
In Gorgias Ecom Lab’s 2025 Black Friday and Cyber Monday window, total pre-purchase volume rose about 51% per day relative to September and October. Policy’s share of the queue also increased by 2.3 percentage points. Using the published rounded inputs, a team with 100 baseline daily tickets would have about 15.3 policy tickets at baseline and 26.6 in the peak mix. About 22.1% of the extra modeled daily queue would be policy questions.
Keep queue size and purchase attribution separate
The later ordinary-window dataset shows why those cases deserve separate routing. Availability made up 30.4% of all classified pre-purchase conversations, more than twice the 14.9% share for brand policy. In Shopping Assistant sales conversations, the ordering reversed for attributed purchases. Brand policy’s 18.7% attributed rate was 9.2 points above availability’s 9.5%.
These rates measure different groups. It would be wrong to multiply the all-channel mix by the assistant-attributed rates and call the result expected store revenue. Use the first number to plan coverage and the second as a signal to look more closely at warranty, wholesale and promotion questions. Measure the order outcome on a consistent local denominator.
Check the coverage gap before changing shifts
A separate Gorgias July 2026 analysis found a median 53% after-hours share for pre-purchase questions. Positive satisfaction scores on rated pre-purchase interactions differed by just one point, 86% during business hours versus 85% after hours. A shopper who left before getting a reply could not contribute a rating. The two measurements tell you different things about overnight coverage.
Start with the week before your next sale. For each question type, count arrivals by hour, time to the first useful response, whether a person needed to make an exception, and whether the checkout reached a paid order. Use the same window for questions that go unanswered. Size the exception queue using arrivals and handling time. Then test a narrower coverage change against a comparable shift before committing to wider hours.
Separate additional arrivals from a different mix of questions
Gorgias reported 51% more pre-purchase questions per day at peak and a rise in the policy share from 15.3% to 17.6%. Start with 100 baseline daily questions and increase volume to 151 while holding the original mix. That gives 7.80 extra policy questions. Applying the peak mix at that volume adds another 3.47. About 30.80% of the increase in this decomposition comes from the mix step. It uses rounded source values and depends on doing the volume step first.
A forecast that increases every category by 51% would miss about 347 additional policy questions per 10,000 baseline pre-purchase questions under those inputs. That is a planning calculation for the benchmark mix. It does not establish incremental orders or predict how a store with a different catalog will distribute questions.
If you apply the mix change to the baseline volume first, the numerical allocation between volume and mix changes. The total predicted policy workload is the same. Quote the ordering with the decomposition and use the total to plan capacity. The two components explain why a simple multiplier can miss the queue’s shape.
Plan one reliable answer path for the policy questions that multiply
Separate a request for a coupon code from a question about stacking that code with a subscription price or another offer. Check the exact rule, its end date and which cart state it applies to. For an exception, route the question to someone who can answer it while preserving the current cart. The biggest traffic queue can remain the largest workload even when a smaller queue grows faster.
Estimate the baseline question mix from the store’s actual tickets. After launch, compare it with peak mix at the same daily counting point. If the mix changes sharply by region or day, have the staffing plan reflect it. Count unanswered and handed-off questions too; otherwise a shift in how the queue is routed can look like a reduction in demand.
Separate questions that can be answered from a published rule from ones that require the actual customer’s promotion eligibility. The first can often use a current policy snippet. The second needs a verified cart, the code and the account conditions. Do not staff those two kinds of cases as if they consume the same time.
Study data
| Measure | Value | Context |
|---|---|---|
| Product-detail share of pre-purchase conversations | 36.6% | Ordinary-window question share |
| Availability share of pre-purchase conversations | 30.4% | Ordinary-window question share |
| Brand policy share of pre-purchase conversations | 14.9% | Ordinary-window question share |
| Brand policy attributed order rate | 18.7% | Shopping Assistant sales conversation outcome |
| Availability attributed order rate | 9.5% | Shopping Assistant sales conversation outcome |
| Brand policy share before peak | 15.3% | September to October 2025 share |
| Brand policy share during peak | 17.6% | November 20 to December 2, 2025 share |
| Pre-purchase conversation volume increase during peak | 51% | Approximate daily volume change |
| Brand policy conversation volume increase during peak | 73% | Approximate daily volume change |
| Brand policy attributed order rate during peak | 21.4% | BFCM Shopping Assistant outcome |
| Health and Beauty brand policy attributed order rate | 21.1% | Ordinary-window industry result |
| Measure | Value | Context |
|---|---|---|
| Pre-purchase questions received after hours | 53% | Median per-account after-hours share |
| Positive CSAT on business-hours pre-purchase tickets | 86% | Positive share in CSAT observations |
| Positive CSAT on after-hours pre-purchase tickets | 85% | Positive share in CSAT observations |
What changes when you compare the figures
| Comparison | Result | Calculation |
|---|---|---|
| Brand policy share increase during the BFCM window | 2.3 percentage points | = 17.6 - 15.3 |
| Normalized peak daily brand policy tickets per 100 baseline daily tickets | 26.58 tickets | = 151 * 17.6 / 100 |
| Additional policy tickets per 100 baseline daily tickets | 11.28 tickets | = 151 * 17.6 / 100 - 15.3 |
| Share of additional daily volume attributable to the policy category | 22.11% | = (151 * 17.6 / 100 - 15.3) / 51 * 100 |
| Brand policy minus availability attributed order rate | 9.2 percentage points | = 18.7 - 9.5 |
| Brand policy relative to availability on attributed order rate | 1.97 times | = 18.7 / 9.5 |
| Business-hours minus after-hours positive CSAT | 1 percentage points | = 86 - 85 |
| Extra policy questions from volume growth at the baseline mix | 7.8 questions per 100 baseline questions | = (151 - 100) * 0.153 |
| Extra policy questions from peak mix at peak volume | 3.47 questions per 100 baseline questions | = 151 * (0.176 - 0.153) |
| Composition share of extra policy questions in sequential decomposition | 30.8% | = 151 * (0.176 - 0.153) / (151 * 0.176 - 100 * 0.153) * 100 |
| Policy coverage omitted by a volume-only forecast per 10,000 baseline presale questions | 347.3 questions | = 151 * (0.176 - 0.153) * 100 |
Methodology and sources
Use Gorgias’s published May to August 2026 question mix and attributed order rates as separate observations. For the 2025 seasonal comparison, start from a normalized 100 baseline daily pre-purchase tickets. Multiply 151 peak daily tickets by the peak policy share, subtract the 15.3 baseline policy tickets and divide that difference by 51 to calculate policy’s share of the extra workload. Results use rounded inputs and illustrate queue mix, not an exact ticket count. Read after-hours and CSAT figures from the separate July 2026 report, keeping its per-account median and rated-conversation denominators.
Download the source data (CSV)
Download the calculations (CSV)
Related reading
AI customer support escalation statistics
AI customer support productivity statistics
Sources and definitions
Gorgias Ecom Lab pre-purchase question study
Gorgias Ecom Lab after-hours pre-purchase question study
The source data includes the population, period, denominator and limitations for every figure.