


Quick answer
In a randomized Taobao experiment involving 5,940 after-sales support agents, giving human agents access to an AI assistant reduced issue identification time by 8.2% and full chat duration by 1.1%. Among chats customers rated, average ratings rose 0.042 points on a five-point scale. The experiment detected no statistically significant change in repeat contact for the same issue within three days.
Key findings and sources
The speed gain was concentrated in diagnosis
In Ni and colleagues’ randomized experiment with 5,940 Taobao support agents, assignment to an AI assistant reduced issue identification time by 8.2% and total chat time by 1.1%. The gap between the reported relative reductions was 7.1 percentage points.
Low ratings fell among rated support chats
In the Taobao experiment, giving human agents access to AI assistance reduced the proportion of rated chats with a score of one or two by 1.2 percentage points and raised the mean rating by 0.042 points on a five-point scale.
Customer rating coverage in the descriptive sample
Ni and colleagues’ Taobao study reports 388,793 rated chats and 2,564,606 chat-duration records, giving 15.16 ratings per 100 chats in the paper’s descriptive sample.
Same-issue return to support within three days
The Taobao experiment detected no statistically significant change in same-issue repeat contact within three days when human agents gained access to AI assistance. Using Table 3’s rounded figures, the approximate 95% interval spans a decrease of 0.39 to an increase of 0.39 percentage points.
Repeat contact and ratings covered different numbers of chats
In Ni et al.’s Taobao descriptive table, 2,564,606 chats had a recorded same-issue repeat-contact field and 388,793 had a rating. The repeat-contact denominator was about 6.60 times the rating denominator.
Average and top-quintile repeat-contact effects differed in Taobao
The Taobao study reported a full-sample same-issue repeat-contact assignment coefficient of 0.000 and a top pretreatment-performance quintile coefficient of 0.009 in its subgroup model. The latter scales to 90 repeat contacts per 10,000 chats.
Taobao randomized AI-assistance study, overall and pretreatment agent performance models. Scale the top quintile’s 0.009 probability coefficient by 10,000. Compare the separately reported overall coefficient to the displayed precision.
Dissatisfaction estimates diverged across pretreatment performance groups
The Taobao subgroup model reported dissatisfaction assignment coefficients of −0.215 for the lowest pretreatment-performance quintile and +0.070 for the highest, a 28.5-point contrast between reported estimates.
Taobao randomized AI-assistance study, dissatisfaction subgroup regression. Subtract the bottom-quintile estimate from the top-quintile estimate and convert proportions to percentage points.
Compare the results
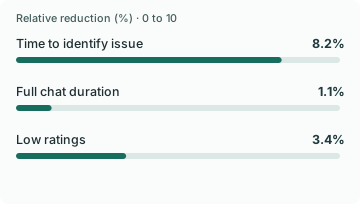
The biggest speed gain came at the start of the chat
The researchers randomly assigned 5,940 official Taobao support agents to have access to an AI assistant or keep using their existing tools. The assistant helped diagnose problems and draft replies. Human agents remained responsible for the conversation. The experiment ran for four weeks and focused on agents who had been in the role for less than a year.
Access reduced issue identification time by 8.2% and full chat duration by 1.1%. The difference between the published relative reductions is 7.1 percentage points. Issue identification improved about 7.5 times as much in proportional terms, using its own baseline. The absolute time savings tell a different part of the story. Diagnosis was 3.2 seconds faster, while the whole conversation was 5.7 seconds shorter. A store should measure both if it wants to see which step the AI is improving.
Customer ratings improved among the chats that were rated
The estimated average rating increased by 0.042 points on a five-point scale when an agent had access to the assistant. Low ratings, defined as one or two stars, fell by 1.2 percentage points among rated chats. The authors report that as a 3.4% decrease relative to the pretreatment dissatisfaction share of 35%. The effects describe customer ratings in the trial and say little about people who chose to leave none.
Table 1 records 388,793 ratings and 2,564,606 chats. Dividing them gives about 15.16 rating records per 100 chats. Show the rating response rate alongside the score in a store pilot. If a change alters which customers leave ratings, the score can move even when the underlying experience stays similar. Compare coverage by treatment group and by issue type before attributing a move to better replies.
Repeat contact tracked an outcome beyond the first conversation
The study looked for a customer returning to the platform about the same issue within three days. The randomized access estimate was 0.000 to the precision shown in the paper and was statistically insignificant. Using the published clustered standard error, the approximate interval spans a decrease of 0.39 percentage points to an increase of 0.39 points. Both small improvements and small increases are compatible with the reported result.
Suppose a customer asks for a refund after a damaged delivery. The first reply can correctly identify the problem and tell the shopper what will happen. The refund may still need approval. A satisfaction rating and a later contact about the same refund answer different questions. Keep a third measure for whether the refund, replacement or other promised action actually happened.
Give a support pilot a clear resolution measure
Start with issues you can trace to an outcome in your support and order systems. Record time to identify the problem, time to the first useful answer and time to the promised action. Track repeat contact over a fixed window by original issue and count status checks only when they concern that issue. Keep an unknown group for conversations you cannot reliably match.
If possible, assign AI access before the agent sees the conversation and keep the comparison group’s existing workflow stable. Read a sample of cases where chat time fell but the shopper returned. The follow-up can reveal whether the original reply was unclear, a shipment or refund stayed unresolved, or a separate question was incorrectly tied to the original case. That distinction gives the team a decision it can make about the workflow.
Count cancelled and unresolved cases explicitly. Dropping cases that leave the normal support path can make the remaining resolution rate look healthier even as more shoppers wait.
Watch who can supply a quality score
In the Taobao descriptive table, 388,793 chats had a customer rating while 2,564,606 recorded duration and the same number had a three-day repeat-contact field. Subtraction leaves 2,175,813 fewer rating observations than duration observations. The recontact analysis had about 6.60 times as many descriptive observations as the rating measure. These counts show the difference in coverage. They do not reveal what the unrated customers would have scored.
Picture a delivery problem that the assistant identifies quickly. One customer gives a rating at the end. Another closes the conversation while waiting for a replacement and writes again the following morning. Ratings describe the first customer’s visible experience; a same-issue contact measure can catch the second customer’s unresolved problem if the two conversations can be linked.
Keep both outcomes on the store’s dashboard and expose the coverage beside the score. In a pilot, show rating invitation and response rates for the assisted and comparison groups. Define what qualifies as the same issue, including contacts that arrive through a different channel. If a workflow raises ratings among people who reply but leaves payment, delivery or return cases just as likely to come back, investigate the unresolved cases before treating the result as a quality gain.
Read the overall repeat-contact estimate beside the agent subgroups
The full Taobao analysis reported an average assignment effect of 0.000 on same-issue recontact to the displayed precision. In the pretreatment-performance subgroup model, the lowest quintile’s estimate was 0.000 and the highest quintile’s estimate was 0.009. The latter represents 0.90 points, or 90 more repeat contacts per 10,000 chats on a common scale. These are rounded estimates from different specifications; the contrast is descriptive without the covariance needed for a separate uncertainty interval.
The same subgroup table reports dissatisfaction estimates of −0.215 and +0.070 for the lowest and highest quintiles. This gives a 28.5-point contrast in the reported coefficients. The dissatisfaction outcome is observed on a narrower sample than recontact. It can explain which groups deserve a closer audit, while the recontact measure tracks an outcome beyond the rating interaction.
A subgroup contrast is useful for choosing where to investigate. It is weaker evidence for declaring that the tool harms a particular group. The available estimates are rounded and their uncertainties can be related. A store testing that question can specify one interaction in advance and keep outcome definitions constant across both groups.
Test the queue where the assistant changes the work
Use the same assignment and follow-up rules for experienced and new agents. The tool might help a new agent find the next step and slow an experienced agent who already knows the answer, or it might help both on a new policy. Group by experience measured before rollout rather than by whether the agent chose to use the tool afterward.
Review the cases behind a repeated contact. A repeated message about the same order can represent a second issue, and a different order number can still be the same unresolved complaint. Decide how to join the records and test that rule on examples before judging the pilot. If a subgroup is too small to estimate the difference precisely, keep it visible as an unresolved result and avoid treating the overall mean as its guarantee.
Compare support work that the agent could complete before deployment with the work added by the tool. A suggestion may be valuable for unfamiliar cases even when aggregate repeat contact is unchanged. Test a case where a customer returns because the same issue is still unresolved and one where they open a legitimate new question.
Study data
| Measure | Value | Context |
|---|---|---|
| Agents in experiment | 5,940 agents | Total randomized agents |
| Agents assigned AI access | 2,895 agents | Randomized to receive access to AI assistant |
| Agents assigned to control | 3,045 agents | Randomized to continue existing workflow |
| Chats with a recorded duration | 2,564,606 chats | Exact descriptive sample count |
| Chats with a customer rating | 388,793 ratings | Exact descriptive rating record count |
| Pretreatment low rating share | 35% | Percentage with a one- or two-star rating |
| Pretreatment average rating | 3.46 points | Mean on a one-to-five scale |
| Same-issue recontact in descriptive sample | 38% | Customer returned for the same issue within three days |
| Issue identification time reduction | 8.2% | Authors’ reported relative access effect, reduction magnitude |
| Full chat duration reduction | 1.1% | Authors’ reported relative access effect, reduction magnitude |
| Low rating reduction relative to pretreatment share | 3.4% | Authors’ reported relative effect, reduction magnitude |
| Issue identification time saved | 3.2 seconds | Reported absolute reduction in time to identify issue |
| Full chat time saved | 5.7 seconds | Reported absolute reduction in chat time |
| Low rating change | -0.012 proportion | Coefficient for customer dissatisfaction, defined as a rating of one or two |
| Average rating change | 0.042 points | Coefficient on the five-point rating scale |
| Same-issue recontact change | 0 proportion | Same issue within three days; rounded coefficient is statistically insignificant |
| Same-issue recontact standard error | 0.002 proportion | Robust standard error clustered by agent |
| Q1 agent repeat-contact assignment coefficient | 0.0 proportion | Bottom quintile of pretreatment performance. |
| Q5 agent repeat-contact assignment coefficient | 0.009 proportion | Top quintile of pretreatment performance. |
| Q1 agent dissatisfaction assignment coefficient | -0.215 proportion | Bottom quintile of pretreatment performance. |
| Q5 agent dissatisfaction assignment coefficient | 0.07 proportion | Top quintile of pretreatment performance. |
What changes when you compare the figures
| Comparison | Result | Calculation |
|---|---|---|
| Descriptive rating coverage | 15.16% | = 388793 / 2564606 * 100 |
| Gap in proportional time reductions | 7.1 percentage points | = 8.2 - 1.1 |
| Ratio of proportional time reductions | 7.45 times | = 8.2 / 1.1 |
| Change in low ratings in percentage points | -1.2 percentage points | = -0.012 * 100 |
| Approximate recontact interval lower bound | -0.39 percentage points | = (0 - 1.96 * 0.002) * 100 |
| Approximate recontact interval upper bound | 0.39 percentage points | = (0 + 1.96 * 0.002) * 100 |
| Shortfall in rating observations versus recorded durations | 2,175,813 observations | = 2564606 - 388793 |
| Descriptive recontact observations per rating observation | 6.6 times | = 2564606 / 388793 |
| Q5 versus Q1 gap in same-issue recontact point estimates | 0.9 percentage points | = (0.009 - 0) * 100 |
| Q5 repeat-contact point estimate per 10,000 chats | 90.0 additional repeat contacts per 10,000 chats | = 0.009 * 10000 |
| Q5 versus Q1 dissatisfaction treatment-effect point estimate contrast | 28.5 percentage points | = (0.070 - (-0.215)) * 100 |
Methodology and sources
We transcribed the randomized assignment counts, exact descriptive chat and rating counts from Table 1, and access effects from Table 3 and section 5.2. We divide exact rating records by the corresponding count of all chats for the displayed coverage. We compare the reported relative changes in issue identification and total chat time by subtraction and division, using rounded published figures. We converted the dissatisfaction coefficient from a proportion to percentage points. We reconstructed an approximate 95% interval for the recontact effect from Table 3’s rounded coefficient and clustered standard error using the normal approximation of 1.96 standard errors on either side.
Download the source data (CSV)
Download the calculations (CSV)
Related reading
AI customer support escalation statistics
AI customer support productivity statistics
Peak-season ecommerce support queue statistics by shopper question
Sources and definitions
The source data includes the population, period, denominator and limitations for every figure.