


Quick answer
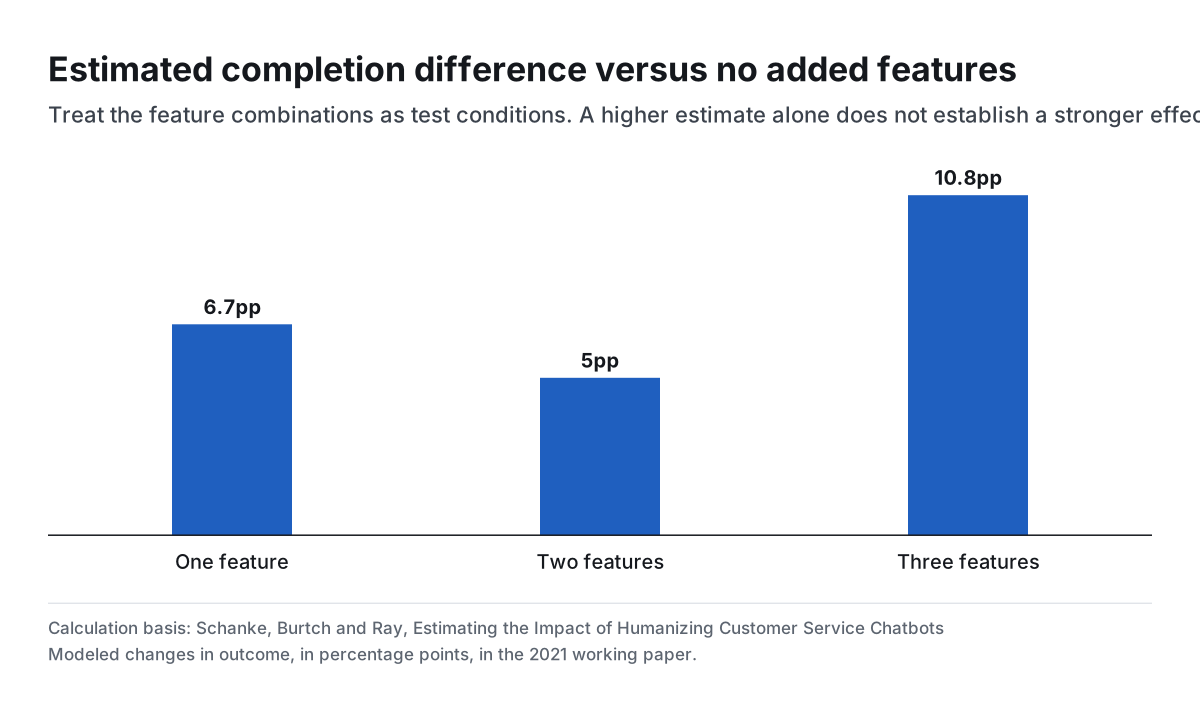
In a 323-person retail buy-back chatbot experiment, the estimated conversion difference for all three human-like features versus none was 10.8 percentage points. One feature estimated 6.7 points and two estimated 5.0. The outcome was getting a shipping label, not an ecommerce purchase.
Schanke, Burtch and Ray, Estimating the Impact of Humanizing Customer Service Chatbots
Key findings and sources
All three features led the one-feature estimate by 4.1 points
Schanke, Burtch and Ray’s retail buy-back experiment estimated a 10.8-point conversion difference for three features versus none and 6.7 points for one versus none. Offload Rep calculates a 4.1-point difference between the estimates.
Schanke, Burtch and Ray, Estimating the Impact of Humanizing Customer Service Chatbots
First-time interactions in a retailer’s used-clothing buy-back chat, and a separate replication in the same setting; Main experiment November–December 2018; replication June–July 2019; MSI working paper 2020. Subtract the one-feature LPM coefficient from the three-feature coefficient in Table 4 column 1; no pairwise significance test is implied.
All three features led the two-feature estimate by 5.8 points
In the 323-person retail buy-back study, the three-feature conversion estimate was 10.8 points and the two-feature estimate 5.0 points, both versus zero features.
Schanke, Burtch and Ray, Estimating the Impact of Humanizing Customer Service Chatbots
First-time interactions in a retailer’s used-clothing buy-back chat, and a separate replication in the same setting; Main experiment November–December 2018; replication June–July 2019; MSI working paper 2020. Subtract 5.0 from 10.8 after converting the LPM coefficients to points.
Two features did not have a higher point estimate than one
The same working paper reported point estimates of 6.7 and 5.0 percentage points for one and two features versus none, respectively, a 1.7-point difference.
Schanke, Burtch and Ray, Estimating the Impact of Humanizing Customer Service Chatbots
First-time interactions in a retailer’s used-clothing buy-back chat, and a separate replication in the same setting; Main experiment November–December 2018; replication June–July 2019; MSI working paper 2020. Compare estimates from the same column, retaining the uncertainty and common comparison group.
The main and replication studies involved 869 participants across separate designs
Schanke, Burtch and Ray report 323 participants in the original buy-back chat analysis and 546 in a separate two-arm replication. Those sample sizes sum to 869 without pooling either result.
Schanke, Burtch and Ray, Estimating the Impact of Humanizing Customer Service Chatbots
First-time interactions in a retailer’s used-clothing buy-back chat, and a separate replication in the same setting; Main experiment November–December 2018; replication June–July 2019; MSI working paper 2020. Add the original and replication sample sizes without averaging their effects.
Compare the results
Estimated completion difference versus no added features
Treat the feature combinations as test conditions. A higher estimate alone does not establish a stronger effect.
Decide which change you are actually testing
The researchers independently randomized three classes of changes. They bundled several signals inside social presence, varied reply pacing and introduced humor. The 10.8-point estimate is for all three classes together versus none. It cannot tell a store which individual change did the work.
In a checkout support chat, start with a specific hypothesis. A plain-language acknowledgement might make an unclear return rule easier to understand, while a typing indicator might change how customers interpret a wait. Give each change a separate comparison when the decision requires it.
The intermediate arms do not establish a stepwise increase
The one-feature point estimate was 6.7 points and the two-feature estimate was 5.0 points. The three-feature estimate was higher than both. The study’s table supplies uncertainty around each estimate. The simple gap between two published coefficients does not test whether one package beats the other.
The study also varied the cash offer, so offer and style are separate variables. A store comparing two support replies should hold the offered remedy constant unless the remedy itself is what it intends to test.
Use a real completion event
The study counted people who finished the buy-back procedure and obtained a shipping label. It did not count merely chatting, accepting a reply or completing a retail purchase. A store should choose its own terminal event before looking at data, such as a payment retry succeeding or a return label being generated.
Keep a plain and accurate description of the assistant. Test language that makes the next action clearer while retaining transparency about whether the shopper is speaking with an automated agent or a person.
Study data
| Measure | Value |
|---|---|
| One human-like feature effect | 6.7 percentage points |
| Two human-like features effect | 5.0 percentage points |
| Three human-like features effect | 10.8 percentage points |
| One feature standard error | 3.6 percentage points |
| Two features standard error | 3.4 percentage points |
| Three features standard error | 5.5 percentage points |
| Three-feature cash offer interaction | 21.1 percentage points per unit |
| One-feature cash offer interaction | 5.2 percentage points per unit |
| Two-feature cash offer interaction | 8.6 percentage points per unit |
| Main experiment analyzed participants | 323 participants |
| Main experiment observed label completion | 8.36% |
| Replication participants | 546 participants |
| Replication treatment share | 46% |
| Replication p-value | 0.046 p-value |
What changes when you compare the figures
| Comparison | Result | Calculation |
|---|---|---|
| All three versus one feature point-estimate gap | 4.1 percentage points | = 10.8 - 6.7 |
| All three versus two features point-estimate gap | 5.8 percentage points | = 10.8 - 5 |
| One versus two feature point-estimate gap | 1.7 percentage points | = 6.7 - 5 |
| Main and replication combined participant counts | 869 participants | = 323 + 546 |
| Three-feature versus one-feature offer interaction gap | 15.9 percentage points per unit | = 21.1 - 5.2 |
Methodology and sources
We read the paper’s randomized treatment design and Table 4 linear probability model. Coefficients and robust standard errors are expressed as percentage points. Pairwise differences compare point estimates only. The replication is a separate two-arm experiment and is kept separate.
Download the source data (CSV)
Download the calculations (CSV)
Download the citation notes (CSV)
Related reading
AI Chatbot Disclosure and Customer Response Statistics
AI customer support escalation statistics
AI customer support productivity statistics
Sources and definitions
Schanke, Burtch and Ray, Estimating the Impact of Humanizing Customer Service Chatbots
The source data includes the population, period, denominator and limitations for every figure.